Sample month
One month, the way you'd get it.
The email, the written month, the printable packet and the app, for a demo practice.
This is what lands in your inbox.
Same month. Two ways to read it.
The month-end packet you get today
| This month | Last month | Same month last year | |
|---|---|---|---|
| Gross production | $171,200 | $178,400 | $164,900 |
| Adjustments | ($17,700) | ($18,400) | ($16,300) |
| Net production | $153,500 | $160,000 | $148,600 |
| Collections | $141,300 | $150,700 | $139,800 |
| Collection rate | 92.1% | 94.2% | 94.1% |
| Total AR | $118,100 | $118,700 | $112,400 |
| AR 60+ | $14,900 | $15,600 | $13,200 |
| AR 90+ | $8,500 | $8,900 | $7,600 |
| Days worked | 19 | 20 | 19 |
| ADP | $8,079 | $8,000 | $7,821 |
| New patients | 61 | 68 | 52 |
The same month, written down
Collections fell $9,400 against last month. $6,100 of that was less dentistry produced; $3,300 was a smaller share of it collected.
New patients came in at 61, down 7 from last month and up 9 on the same month last year.
Your 90-day receivable is 7.2% of what you're owed. Two thirds of it is sitting with insurance, not with patients.
Example figures. Not a real practice.
- Collections$141,300−$9,400 vs last month
- Production$153,500−$6,500 vs last month
- Collection rate92.1%−2.1 pts vs last month
- New patients61−7 vs last month · +9 vs same month last year
- Production per day$8,079+$79 vs last month
- 90-day receivable7.2%−0.3 pts vs last month
The same page, rewritten. No number changes, only who it's written for.
Each line reads left to right: 13 months, from the same month last year to this month.
Example figures. Not a real practice.
What you get every month
Your numbers, pulled and checked.
We check every figure before anyone acts on it. Impossible negatives, rates over 100%, empty months and stale files get caught first.
A plain-English read.
Every number comes with one sentence on what it means. Where the obvious reading is wrong, we say so.
A call, once a month.
Thirty minutes, and we have already read it. You get the two or three things worth your time, not a tour of a dashboard.
The work around the numbers.
Org charts, an equipment list, lease dates and a document library. The paperwork a group keeps, kept for you.
Here is what moved this month.
- Collections$141,300
- Production$153,500
- New patients61
Collections −$9,400 vs last month. Net production −$6,500. Collection rate −2.1 pts.
Collections fell $9,400. $6,100 of that was less dentistry. $3,300 was a smaller share of it collected.
Your 30 minute call is booked. We will start with collections.
Example figures. Not a real practice.
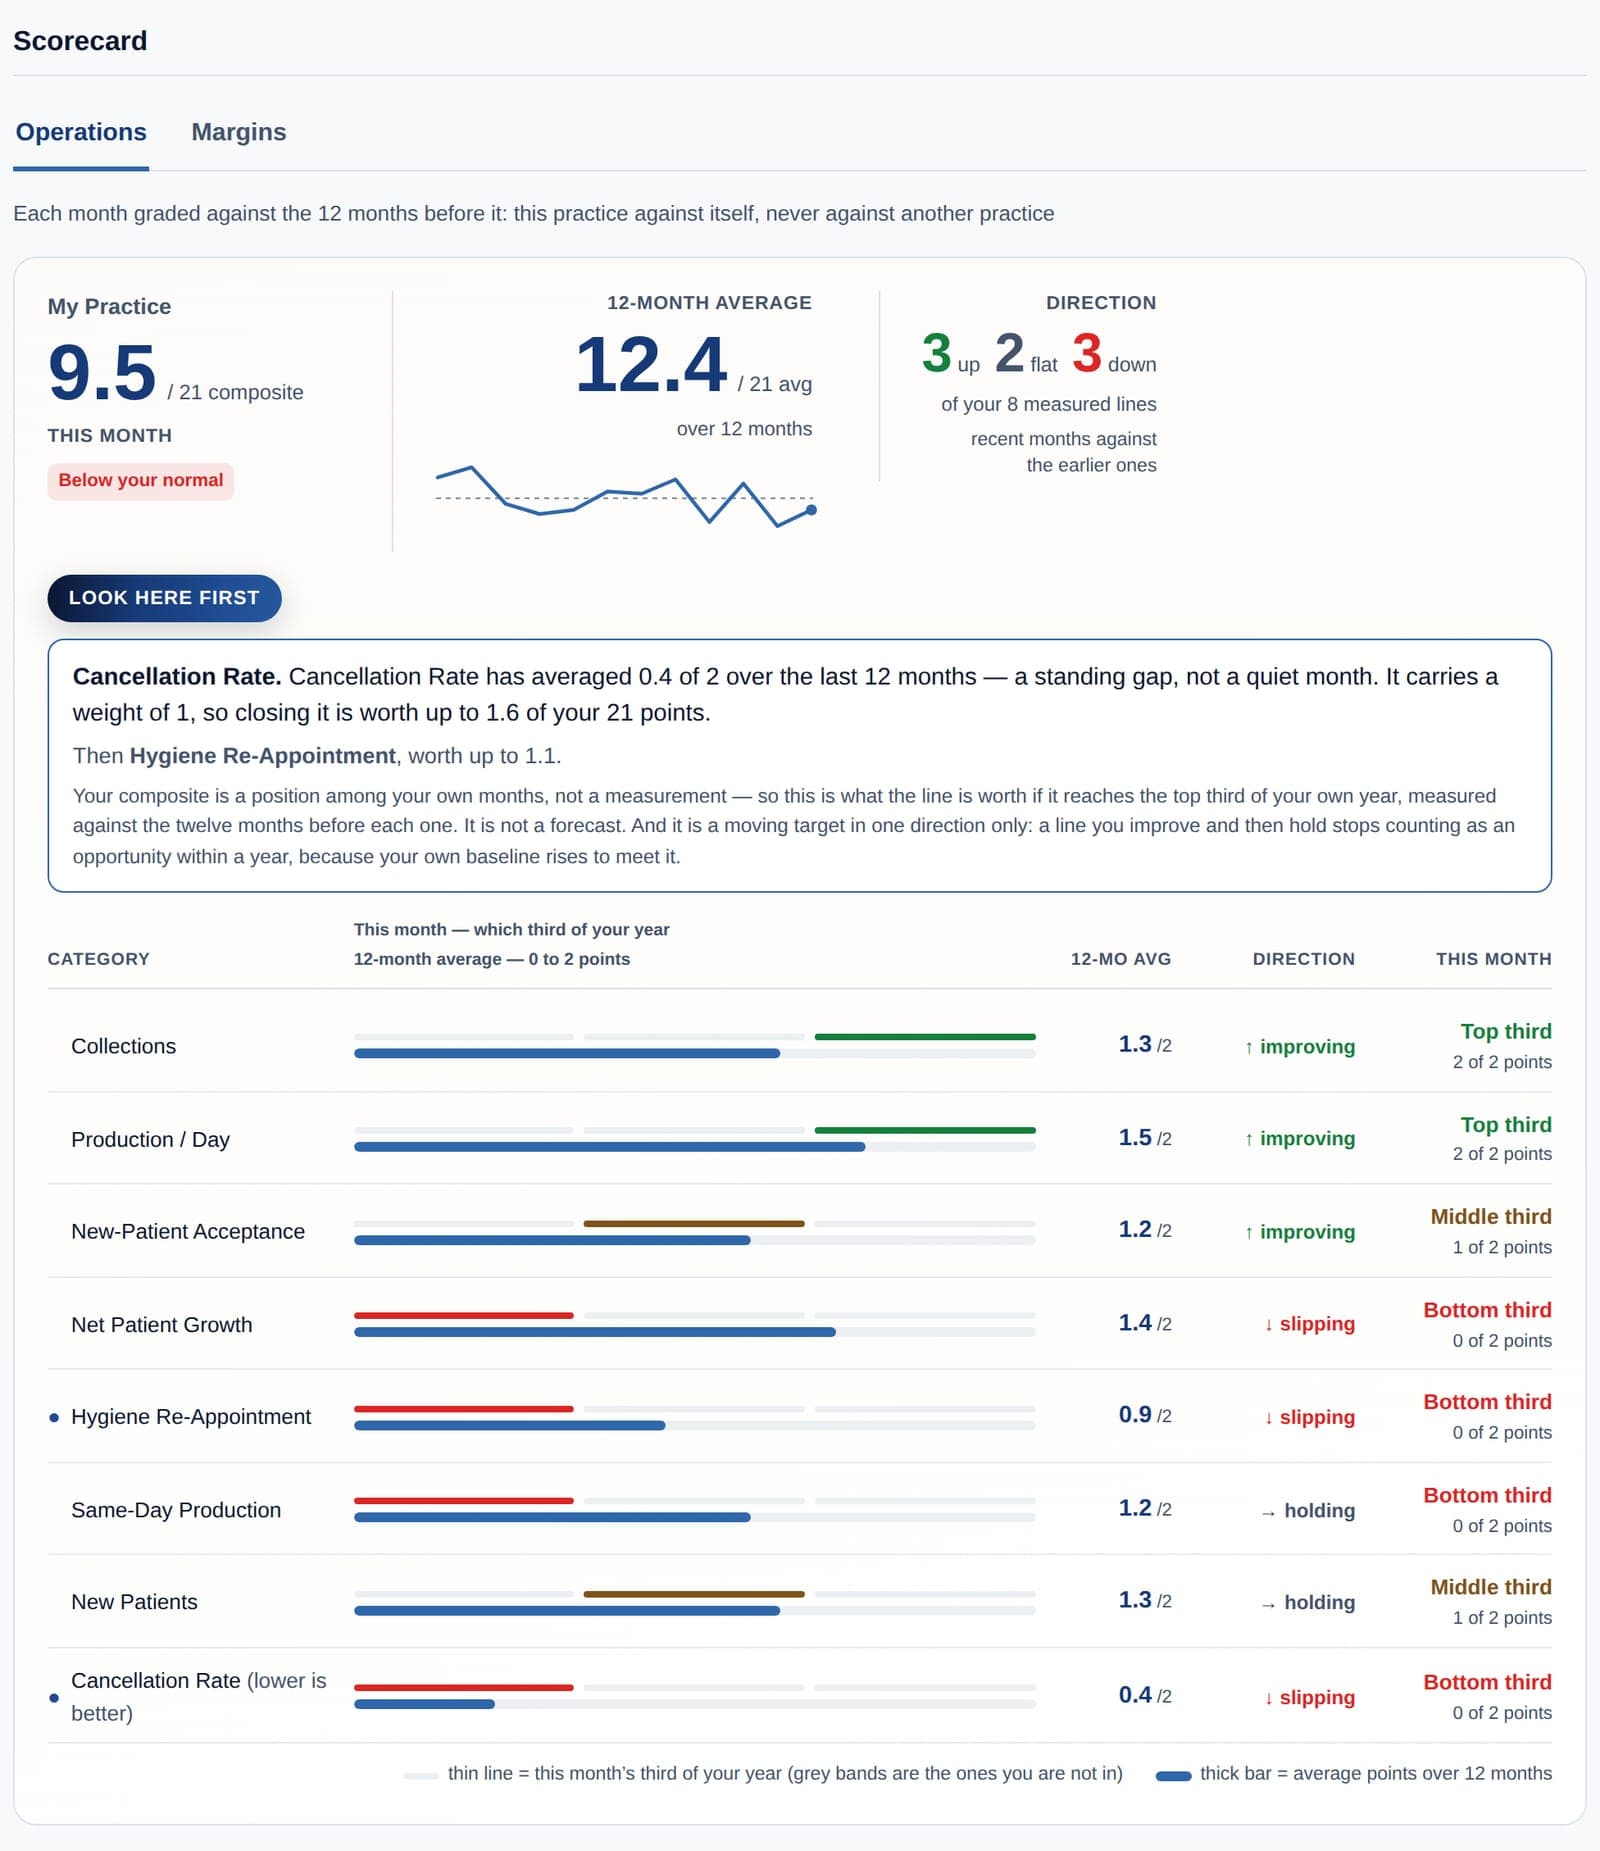
The scorecard grades each month against your own last 12, and points at the one line to look at first.
Example figures. Not a real practice.
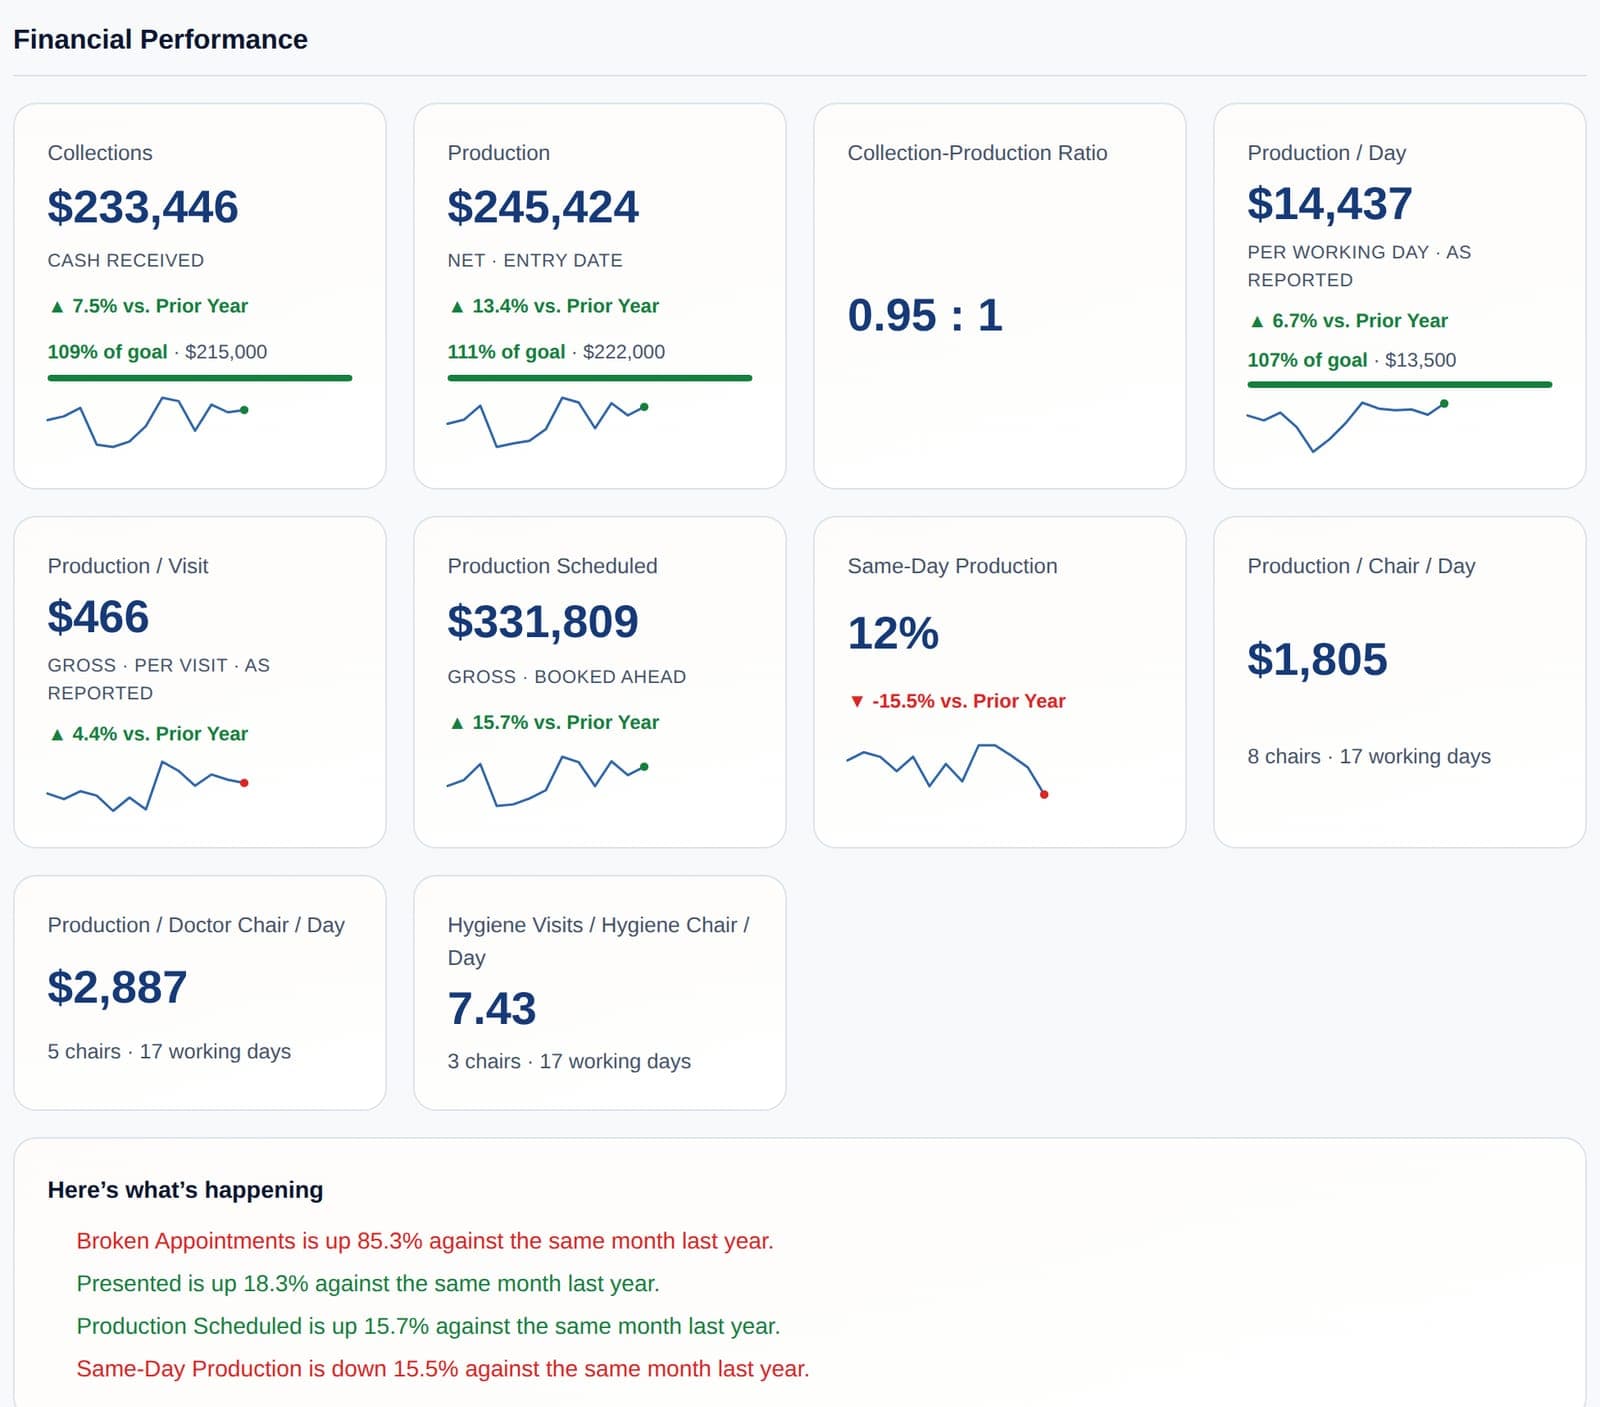
Every tile shows the number, the change from last year, and the trend behind it.
Example figures. Not a real practice.
Plus a full packet you can print.
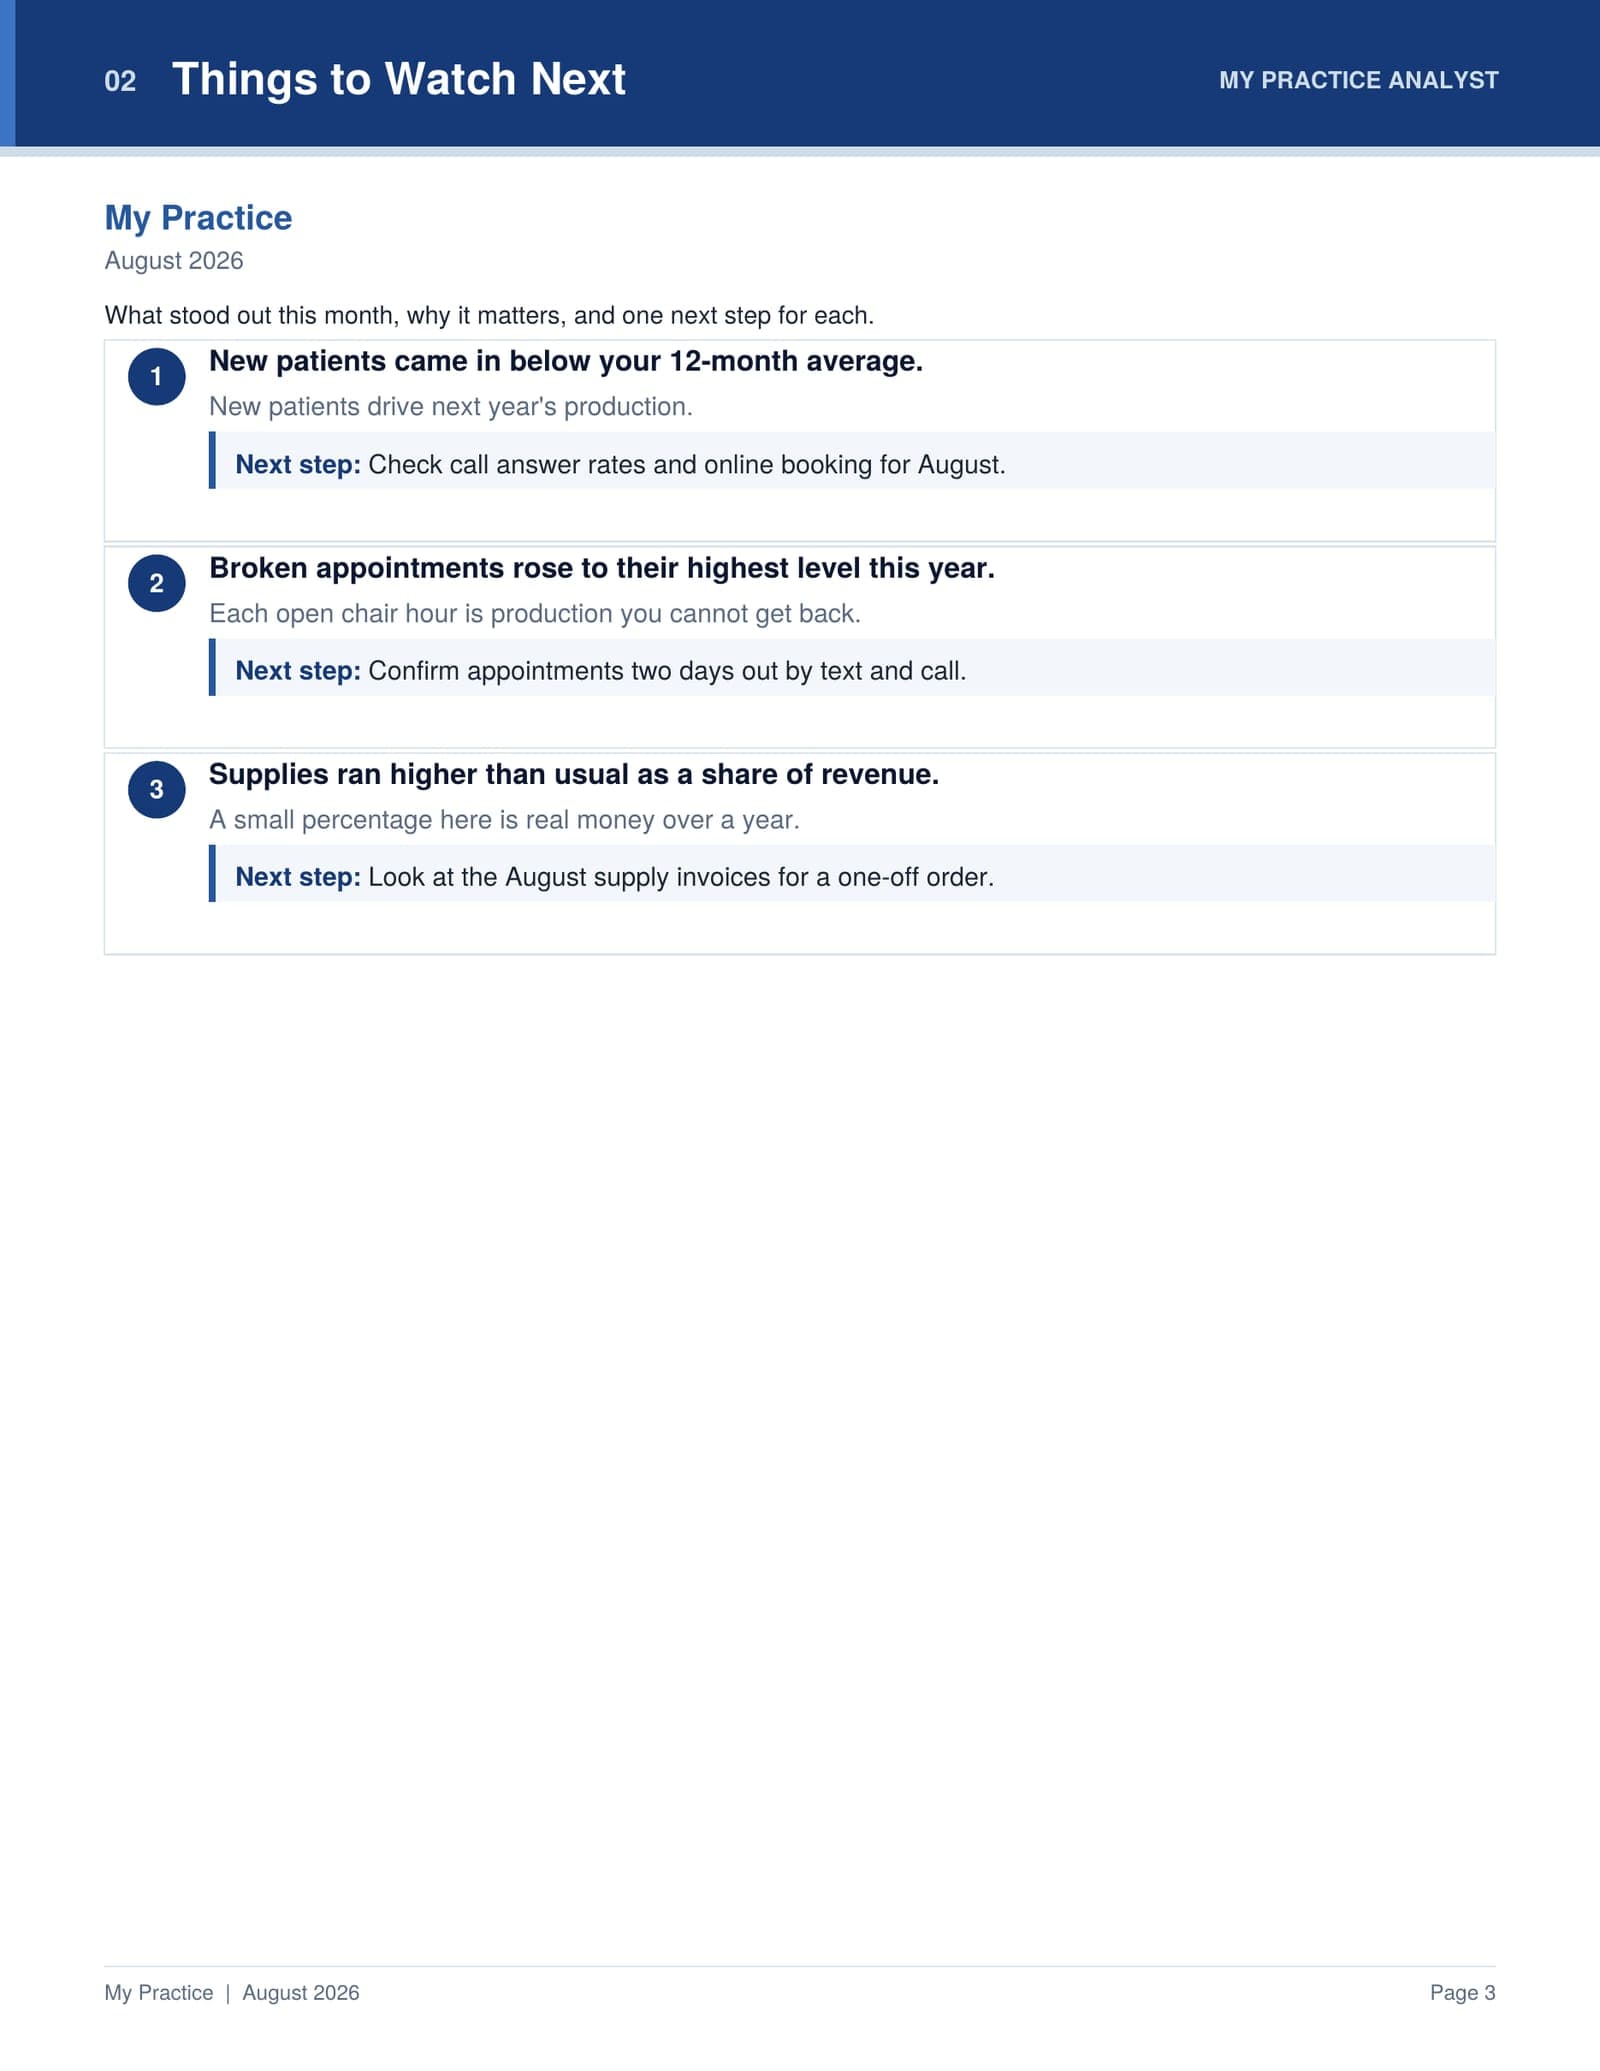
Every month also comes with a PDF your office manager, partner or accountant can read. Same numbers, laid out like a real financial packet.
Example figures. Not a real practice.
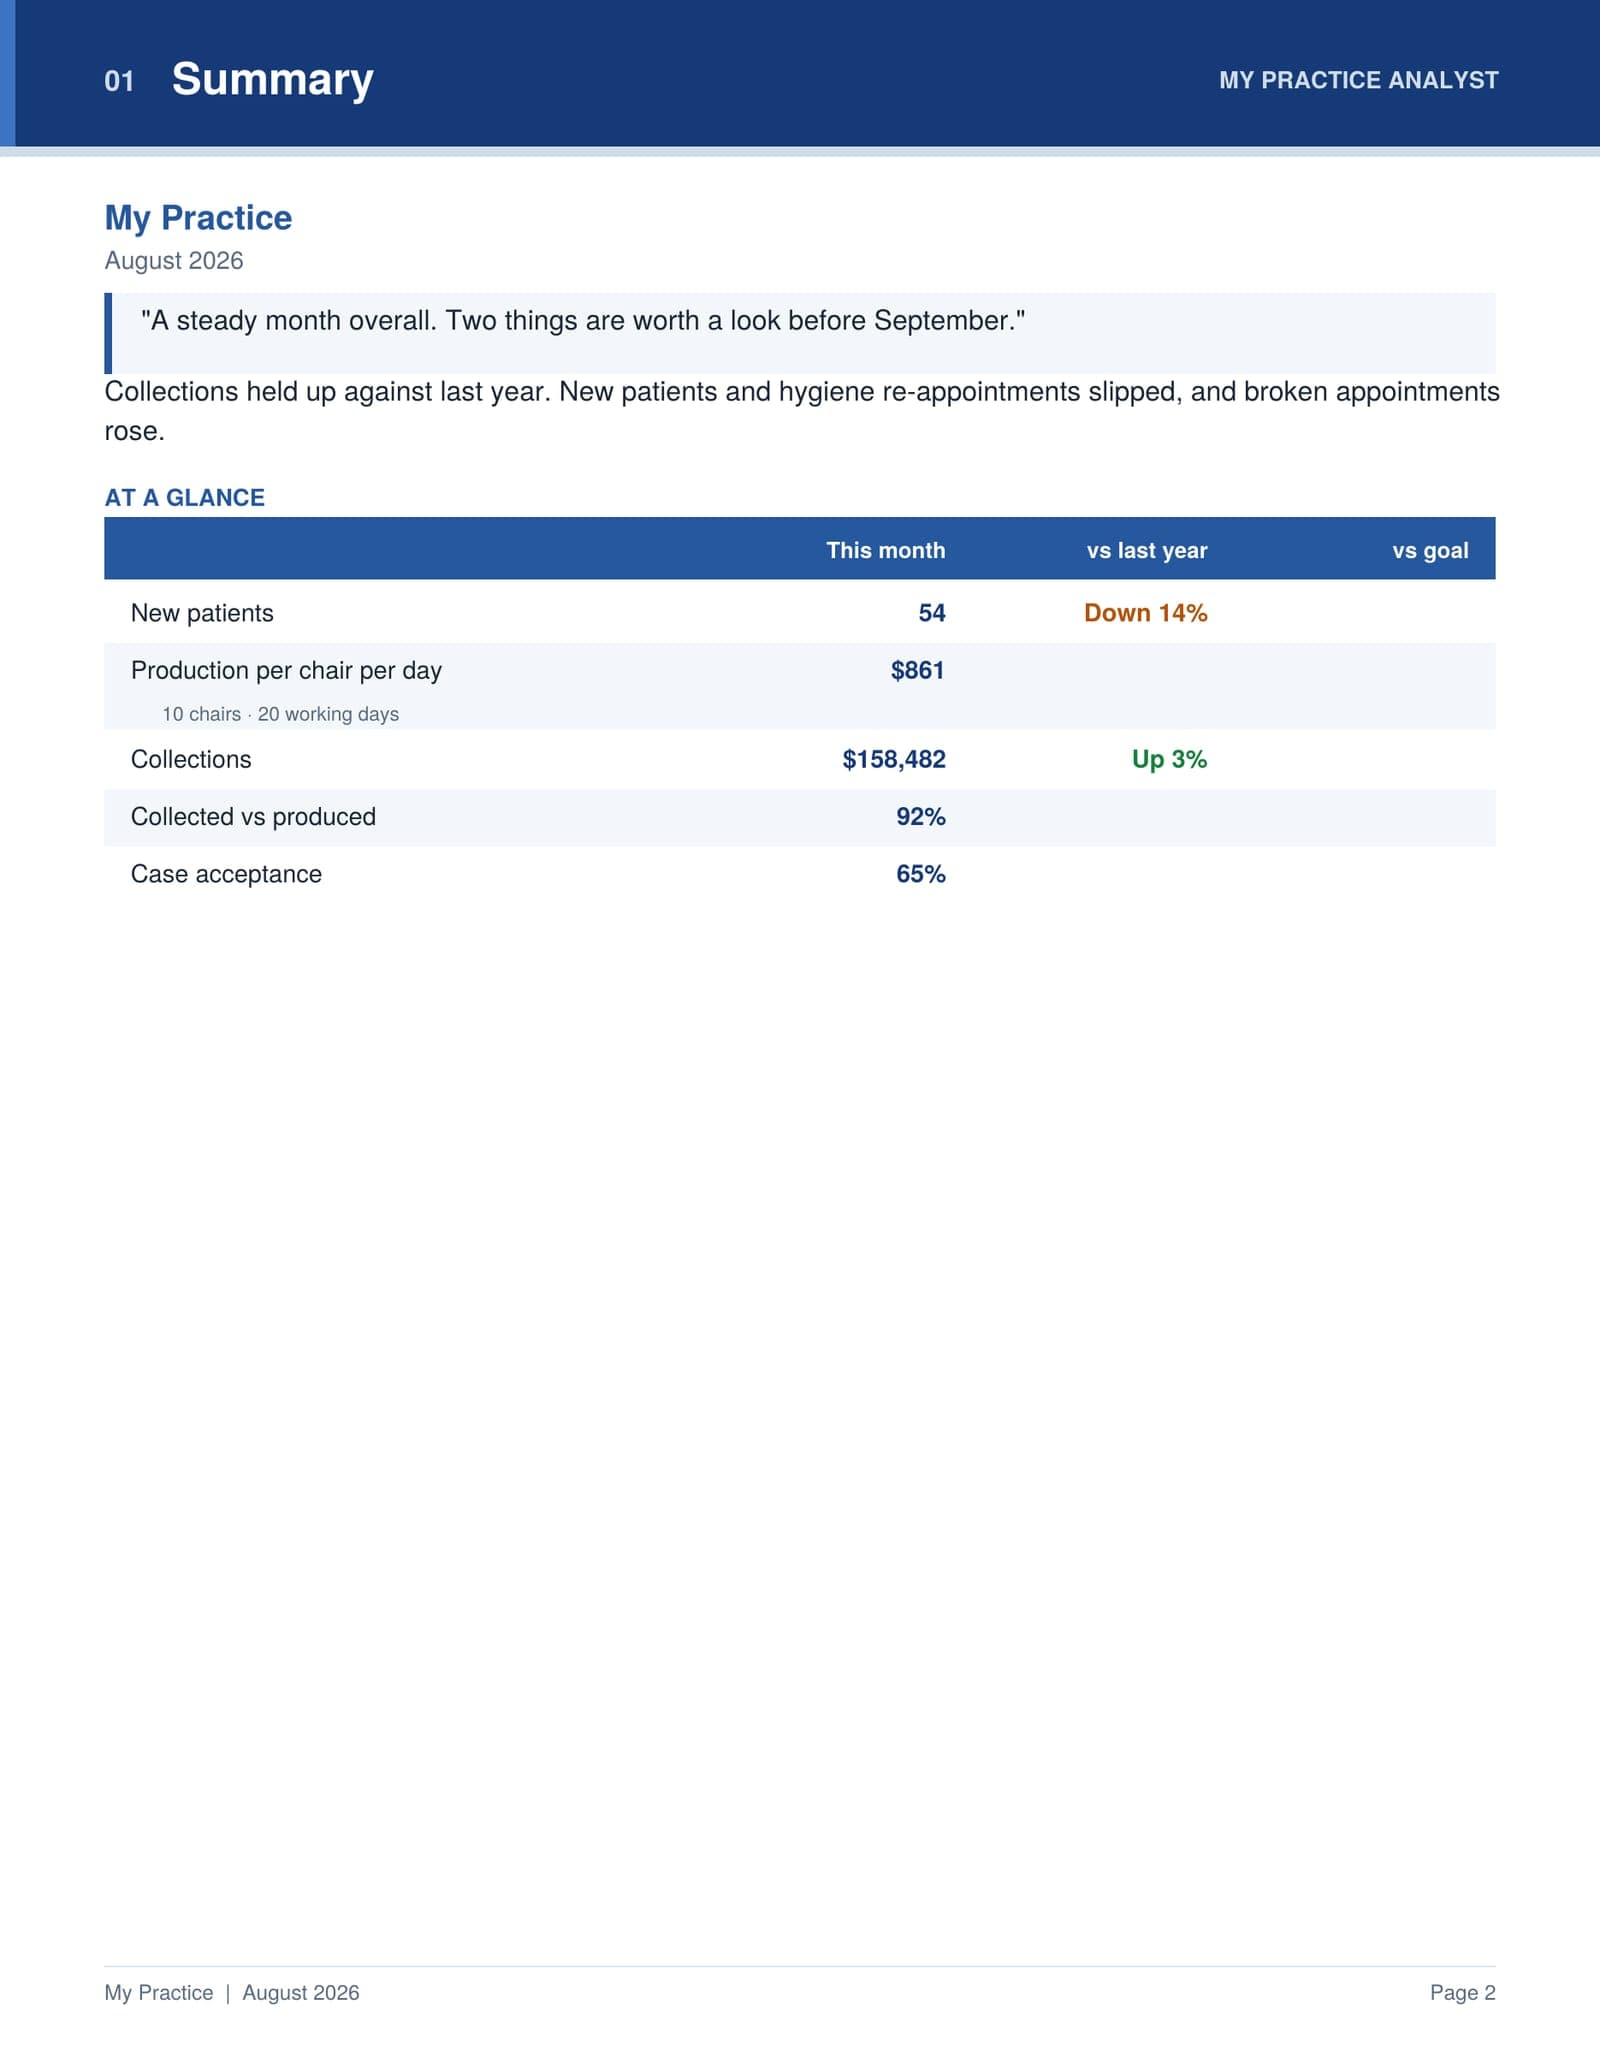
- 01
Summary
A short note and the month at a glance.
- 02
Things to watch next
What stood out, why it matters, one next step.
- 03
12-month trend
Every month side by side, blanks never shown as zero.
- 04
Receivables
Who owes you, and for how long.
- 05
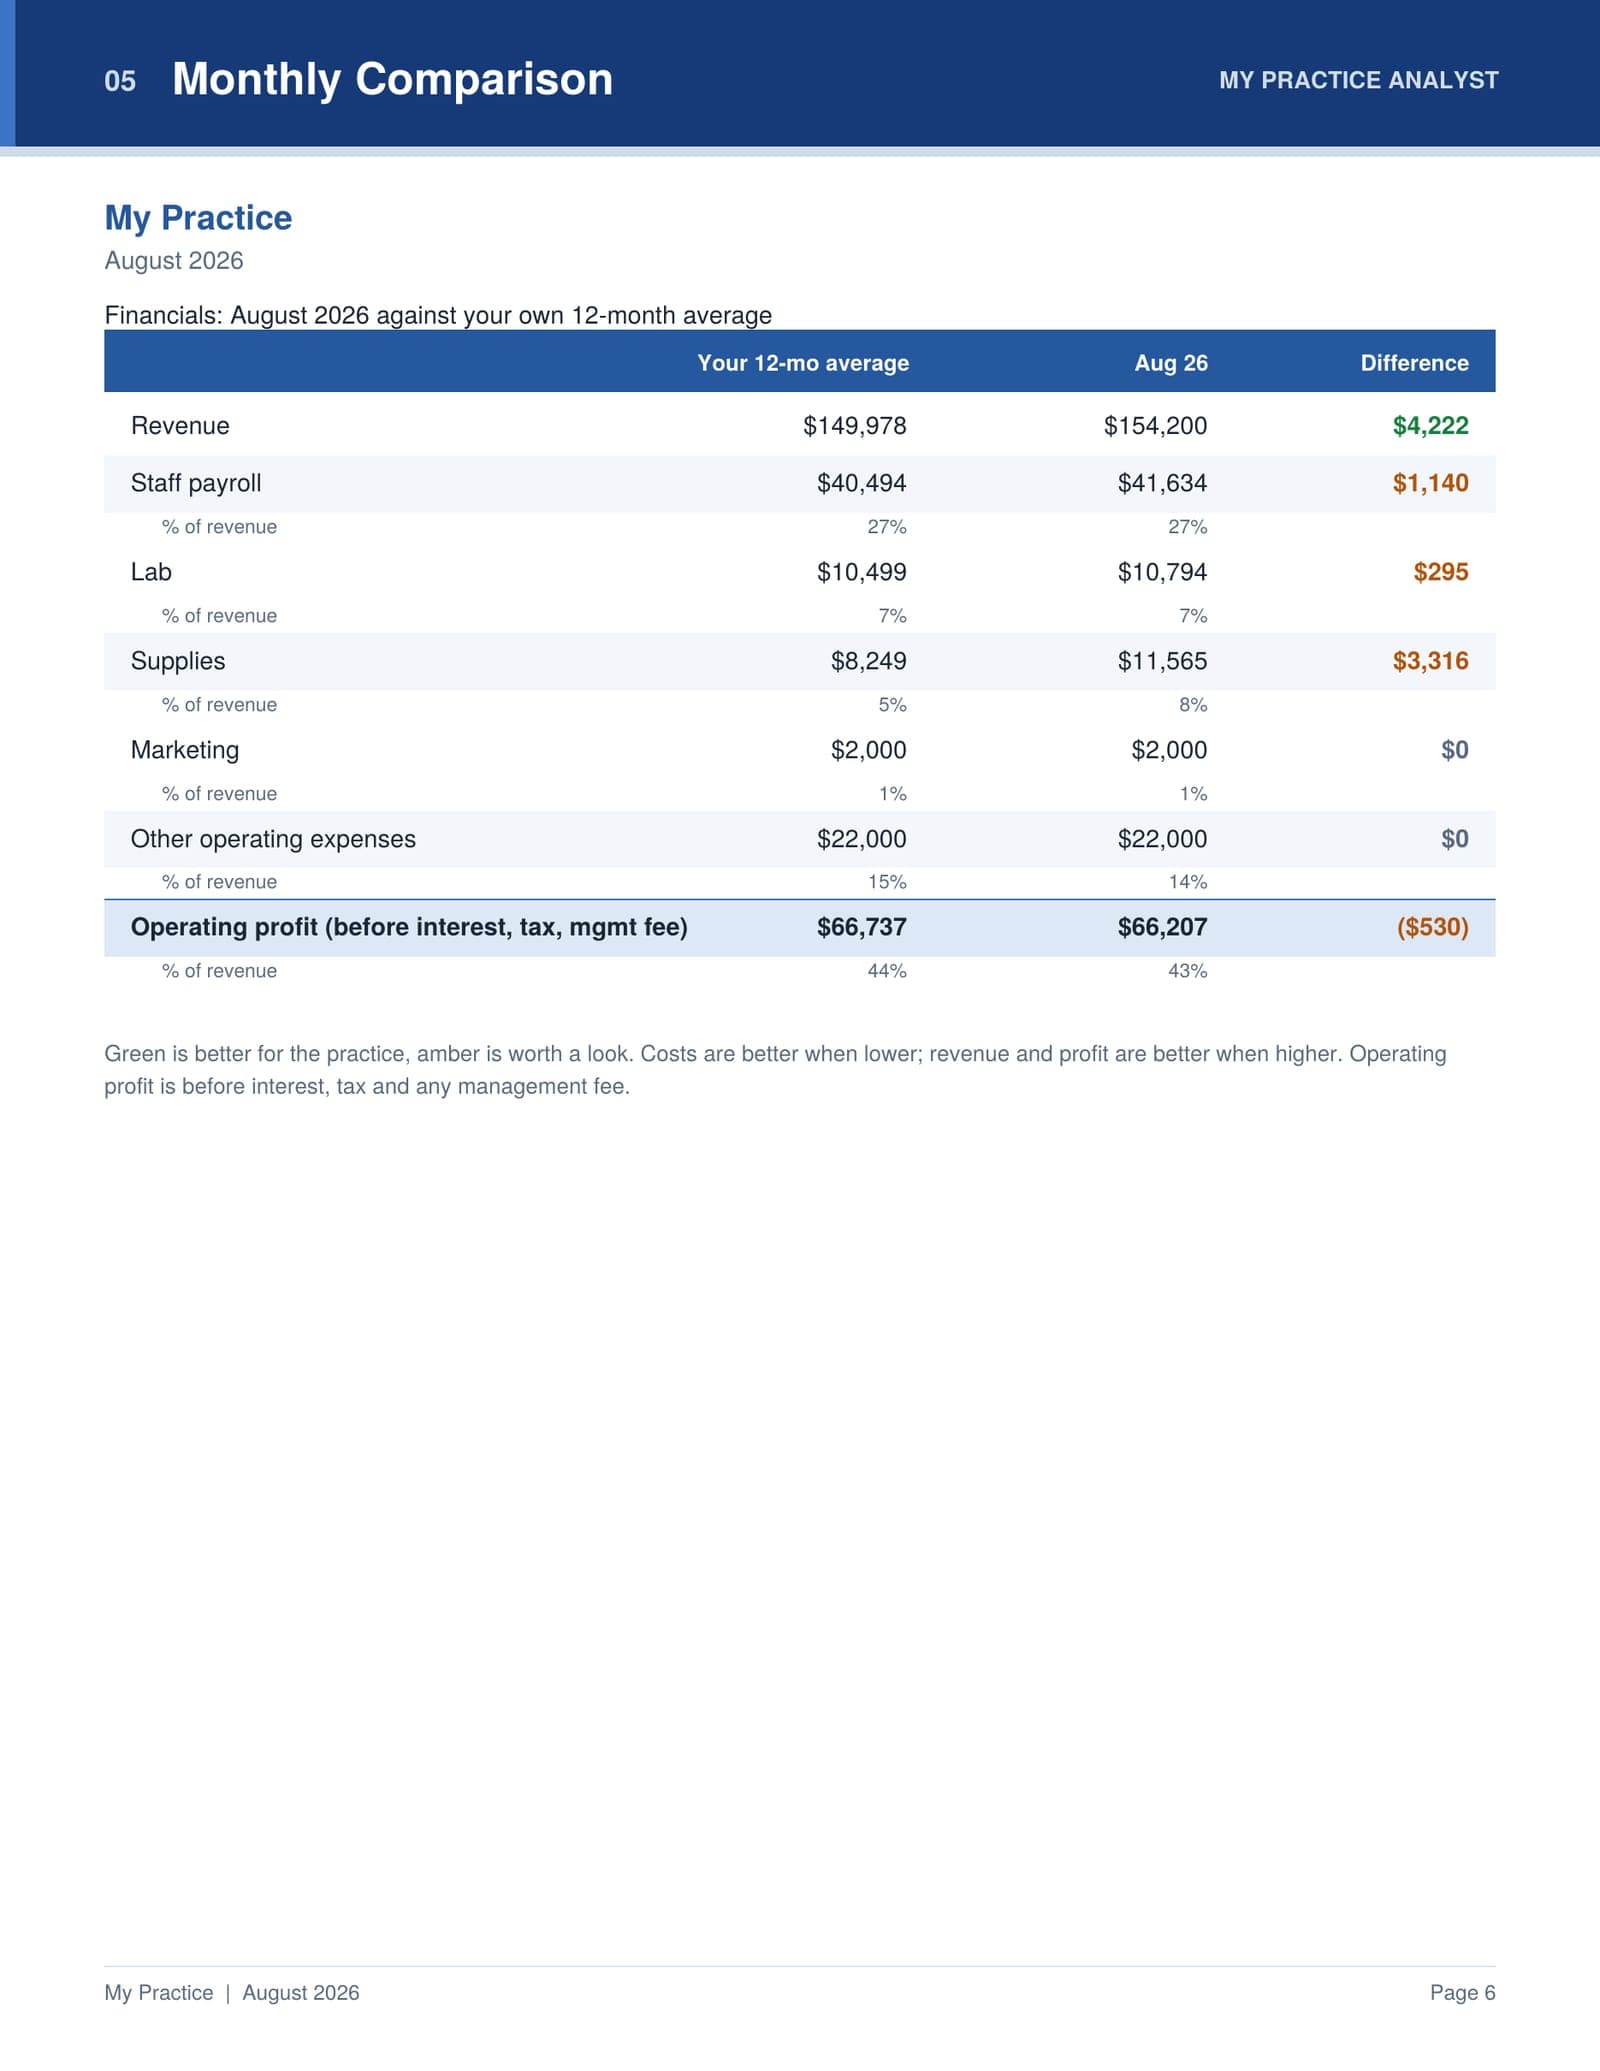
Your P&L
Against your own average, last 12 months and last year.
Your P&L sits next to its own history: your 12-month average, the last 12 months, and the same month last year. Green is better for the practice, amber is worth a look.

Send one month. See what comes back.
Your first report is built before you decide anything.
Get your quoteMonth to month. Cancel anytime. No software to switch.